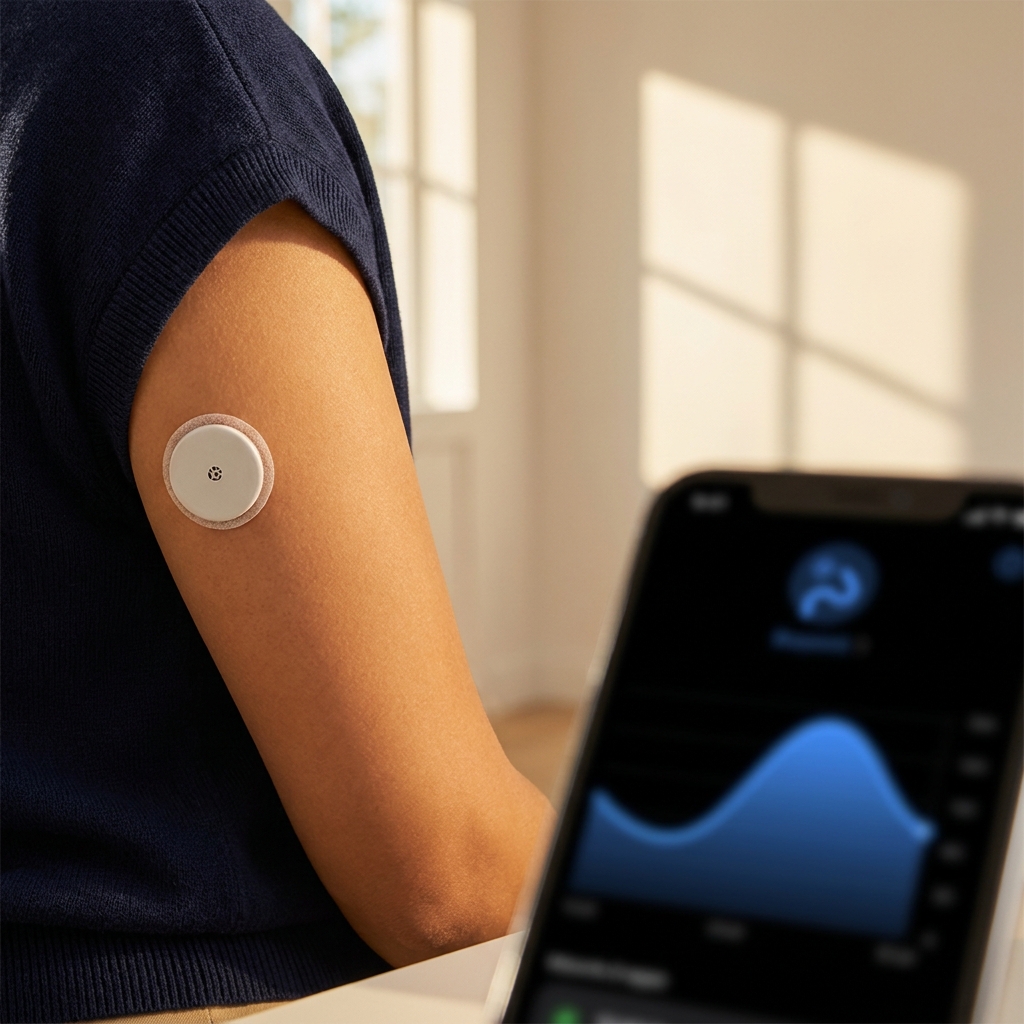
A continuous glucose monitor used to be a prescription-only device for people with type 1 diabetes. Now a Dexcom Stelo, an Abbott Lingo, or a Nutrisense or Levels subscription will put a sensor on your arm for 14 days for a few hundred dollars. Suddenly every founder, runner, and longevity-curious office worker is watching their postprandial glucose climb after a croissant and asking whether they just did something terrible to their pancreas.
They probably didn't. But "CGM without diabetes" is genuinely useful if you know what you're reading — and genuinely misleading if you don't. This guide walks through what a healthy adult's glucose curves actually look like, what the dawn phenomenon is doing to your fasting number, how to interpret glucose variability metrics like MAGE and CV, and how time in range applies when you're not diabetic. We'll compare Dexcom G7, Abbott Libre 3, Stelo, and Lingo, and be honest about when a $300 month of CGM data is worth it versus when it's overkill wearable theater.
Key Takeaways
- Peaks under 140 mg/dL and a return to baseline within 2 to 3 hours is the healthy adult pattern. Isolated spikes are not a disease.
- The metrics that matter are glucose variability (CV under 36%), MAGE, and time in range 70 to 140 mg/dL above 90% — not any single spike.
- The dawn phenomenon is a normal cortisol-driven morning rise. It is not a sign of prediabetes on its own.
- CGM-driven weight loss effects disappear once you control for calorie awareness. The sensor is a behavior tool, not a metabolism tool.
- For most healthy adults, 30 days of CGM is a learning exercise — not a lifelong subscription. HbA1c and fasting insulin give you more disease-relevant signal for less money.
Medical disclaimer: This article is educational, not medical advice. If you suspect diabetes, prediabetes, reactive hypoglycemia, or any metabolic condition, talk to a physician. CGM data is a tool, not a diagnosis — interpret it with your full health picture, not a blog post.
Why Everyone Suddenly Has a CGM
Two things changed. First, the FDA cleared over-the-counter CGMs in 2024 — Dexcom Stelo and Abbott Lingo can now be bought online without a prescription. Second, Levels and Nutrisense built clean consumer apps on top of prescription sensors and spent aggressively on content marketing. The result: a sensor category that used to serve 8 million diabetics in the US is now a wellness category pitched at the other 330 million of us.
That is not automatically bad. A CGM can teach you in two weeks what took our grandparents a lifetime to guess: which meals spike you, how fast you recover, how much sleep deprivation costs your fasting glucose, how your body handles a long run versus a hard lift. The question is whether those lessons are worth the price tag for a non-diabetic, and whether the conclusions people draw from them are actually true.
Kevin Hall — the NIH metabolism researcher — has publicly pushed back on the "spikes are dangerous" narrative, pointing out that the evidence for acute postprandial glucose mattering in metabolically healthy adults is thin. Peter Attia has made similar points in interviews: the CGM is a useful tool, but most of its consumer framing conflates "this rose my glucose" with "this harmed me," and those are not the same claim.
What a Healthy Non-Diabetic Glucose Curve Actually Looks Like
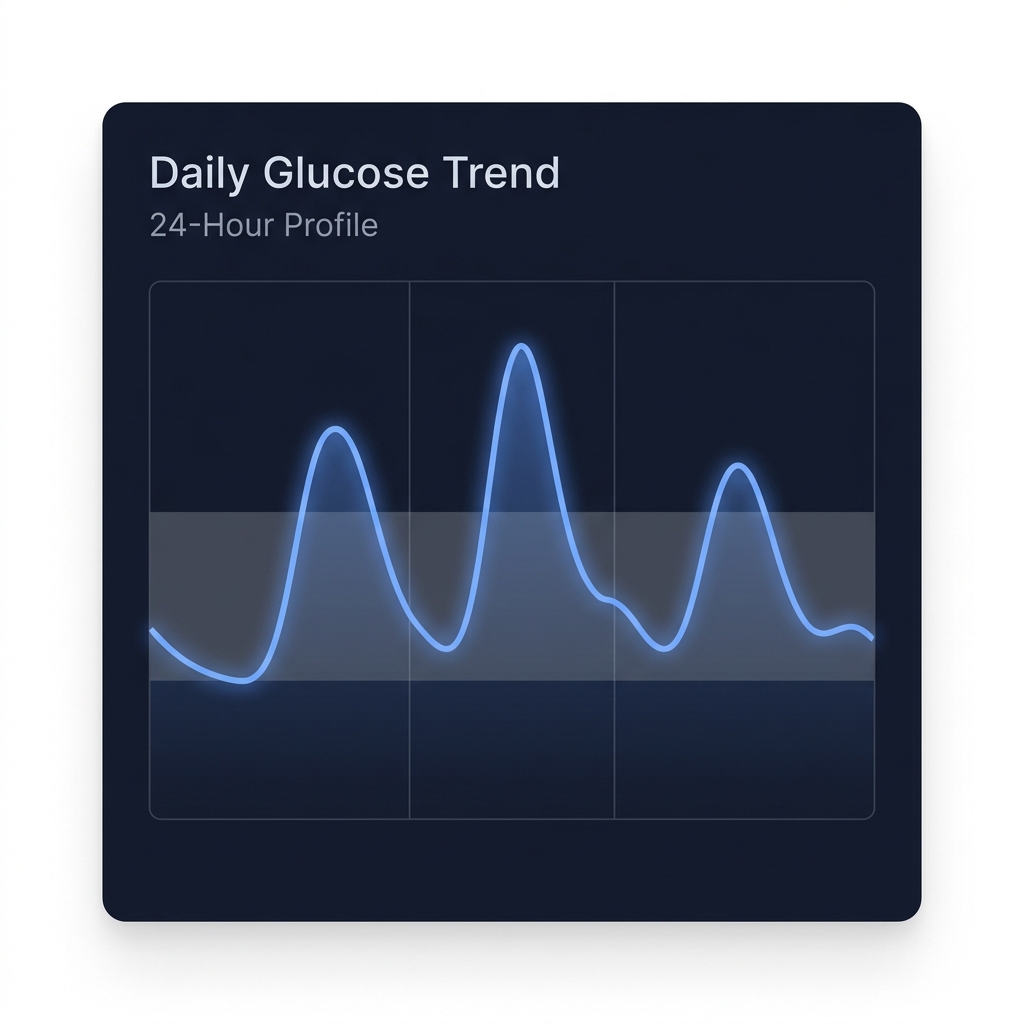
Before we get into targets and variability metrics, anchor on the shape. A healthy adult's 24-hour glucose curve has a few defining features:
- An overnight fasting floor somewhere in the 75 to 95 mg/dL range.
- A dawn bump — cortisol and growth hormone nudge glucose up 10 to 25 mg/dL in the hour or two before waking.
- Three or four meal-related peaks, each rising roughly 20 to 50 mg/dL above baseline, rarely crossing 140 mg/dL.
- A return to within 10 mg/dL of pre-meal baseline within 2 to 3 hours.
- Gentle undulation during the day, not a knife-edge line.
That is the shape. Not flat. Not a heartbeat. A gently rolling hill country with a few small mountains at meal times.
The Classic Stanford Findings
The Stanford research group led by Michael Snyder — often cited as "Spyros and Snyder" style glucose variability research, though the frequently-referenced Stanford group's lead investigator on CGM variability is Snyder — published a landmark 2018 paper using CGMs in adults without diabetes. They found three distinct glucotypes: low variability, moderate, and severe. Roughly a quarter of participants in the "severe" glucotype had HbA1c in the normal range. The conclusion was not "all of these people are prediabetic." It was "glucose variability is heterogeneous in healthy adults, and HbA1c alone may mask real metabolic differences."
Two things to take from that paper. One: variability is a real signal that adds information beyond HbA1c. Two: being in the "severe" glucotype didn't mean someone was sick. It meant their biology responded more dramatically to carbs. That distinction matters.
Healthy Non-Diabetic Glucose Targets
Here is the clean reference table. These are the numbers our team uses when coaching members through their first CGM month. Values synthesize published non-diabetic CGM data (JAEB, Stanford, Dexcom G6 healthy cohort studies) and are intended as orientation, not diagnosis.
| Metric | Healthy Non-Diabetic Range | Notes |
|---|---|---|
| Fasting glucose | 70 to 99 mg/dL (target 80 to 90) | Measured overnight or before breakfast |
| 1-hour post-meal peak | Under 140 mg/dL, often 110 to 135 | Typical peak window is 45 to 75 minutes |
| 2-hour post-meal | Under 120 mg/dL; within 10 mg/dL of pre-meal | Standard oral glucose tolerance threshold |
| Peak spike (occasional) | Up to 160 mg/dL is common for carb-heavy meals | One spike is not a diagnosis |
| MAGE (mean amplitude of glycemic excursions) | Under 40 mg/dL | Measures the size of meaningful swings |
| Coefficient of variation (CV) | Under 36% (optimal under 24%) | The single best variability metric |
| Time in range 70 to 140 mg/dL | Over 90% (aim for 95%+) | Non-diabetic standard; diabetics target 70 to 180 |
| HbA1c (context, not CGM) | Under 5.4% longevity-optimal | 3-month glucose average; anchors the CGM data |
What a "Good" Post-Meal Curve Looks Like
A healthy post-meal response has three properties, not one:
- Modest peak amplitude. Rise of 20 to 50 mg/dL above your pre-meal value. Not zero — zero would mean you're not digesting anything.
- Fast rise. Peak within 45 to 75 minutes. A flat, delayed climb that peaks at 90+ minutes can signal slower insulin response.
- Clean recovery. Back within 10 mg/dL of baseline by 2 to 3 hours. This is the part most "avoid all spikes" content ignores. A 135 mg/dL peak that returns to 88 mg/dL in 90 minutes is a beautiful curve, not a warning sign.
The Dawn Phenomenon: Why Your Fasting Number Lies
You wake up, check your CGM, and see 108 mg/dL. You ate nothing for 10 hours. You panic-Google "prediabetes fasting glucose."
Slow down. This is likely the dawn phenomenon, a normal physiological event. In the hours before waking, cortisol, growth hormone, and glucagon rise to prepare you for the day. Your liver releases glucose. Your fasting number at 7 a.m. can easily be 10 to 25 mg/dL higher than your 3 a.m. nadir.
The practical implications:
- Don't over-index on your first reading of the morning.
- Look at your overnight minimum, typically between 2 a.m. and 4 a.m., for a truer "resting" number.
- A sustained dawn rise above 110 mg/dL for weeks, paired with rising HbA1c and climbing fasting insulin, is worth a conversation with your doctor. One morning of 107 is not.
The extended dawn phenomenon — where glucose keeps climbing for an hour or two after you wake, even without eating — is more commonly associated with insulin resistance and is a better early warning than the pre-waking rise itself.
Glucose Variability: the Metric That Beats the Spike Panic
Single spikes are the wrong thing to obsess over. Variability is the better story.
Two people can both have an HbA1c of 5.3%. One runs a smooth 90 to 115 mg/dL all day. The other whipsaws between 65 and 165 mg/dL, with a reactive low after every peak. Same average. Very different biology. The second pattern is associated with worse cardiovascular outcomes in several observational datasets, and it's exactly what CGM data reveals that a single blood draw cannot.
CV: The One Metric Most CGM Apps Agree On
Coefficient of variation (CV) is the standard deviation of your glucose divided by your mean, expressed as a percentage. It's the cleanest way to quantify how much your glucose moves around.
- CV under 36%: the widely accepted threshold for "stable" glucose in diabetes literature, and a reasonable ceiling for healthy adults.
- CV under 24%: what we see in metabolically very healthy non-diabetics in published CGM datasets.
- CV over 36% in a non-diabetic: worth investigating. Usually lifestyle-driven (sleep, stress, ultra-processed food frequency) rather than pathological, but useful signal.
MAGE: The Swing Size Metric
MAGE (mean amplitude of glycemic excursions) averages the size of your meaningful peak-to-trough swings, filtering out tiny wobbles. Under 40 mg/dL is the informal healthy target. MAGE of 60+ in a non-diabetic almost always points to food choices or timing — late-night carbs, big breakfast of juice and cereal, reactive lows after high-glycemic meals.
Time in Range for Non-Diabetics
The diabetes version of time in range (TIR) uses 70 to 180 mg/dL. For non-diabetics, tighten that: 70 to 140 mg/dL. A metabolically healthy adult should spend more than 90% of a 24-hour day in that tighter range, and ideally over 95%. If your TIR at 70 to 140 is 82%, you're probably eating more refined carbs than your biology prefers, or you're not sleeping enough, or both.
What Spikes Are Actually Normal
This section matters because it is where most CGM marketing gets people wound up about the wrong thing. Here is the realistic spectrum:
- Normal and healthy: oatmeal with berries — peak 125 mg/dL, back to baseline in 100 minutes.
- Normal: pizza and a beer — peak 148 mg/dL, back to baseline in 150 minutes with a slight dip below baseline around hour 3.
- Normal but loud: orange juice on an empty stomach — peak 165 mg/dL in 40 minutes, back to 90 mg/dL by 120 minutes.
- Worth a second look: peaks repeatedly over 180 mg/dL from ordinary meals, or peaks that don't recover within 3 hours.
- Worth medical attention: sustained glucose over 200 mg/dL, recurrent fasting glucose over 126 mg/dL, HbA1c at or above 6.5%.
The bottom line: isolated peaks into the 140s from a carby meal are a normal physiological response in healthy people. Treating every peak as a disaster is how biohackers end up with disordered eating wrapped in glucose charts.
Which CGM Should You Actually Buy?
There are now five main paths for a non-diabetic to get CGM data. The sensors themselves come from two manufacturers — Dexcom and Abbott — and the rest is app layer and coaching wrap.
| Product | Sensor | Price (30 days) | Prescription? | App / Ecosystem | Best For |
|---|---|---|---|---|---|
| Dexcom Stelo | Dexcom, 15-day wear | ~$99 per sensor, ~$198/mo | No (OTC) | Clean standalone Stelo app; basic insights | Simplest, cheapest first-time experiment |
| Abbott Lingo | Libre-family, 14-day wear | ~$89 per sensor, ~$178/mo | No (OTC) | Lingo app; gamified "metabolic score" | Behavior nudges, not deep data |
| Abbott Libre 3 / Libre 3 Plus | Libre 3, 14 or 15-day | ~$75 per sensor (varies) | Yes in US | LibreView / LibreLink | Diabetes standard; best raw accuracy on Abbott side |
| Dexcom G7 | Dexcom G7, 10-day | ~$90 per sensor | Yes in US | Dexcom G7 app; integrates with Apple Health | Diabetes gold standard; lowest MARD (~8%) |
| Nutrisense | Libre or Stelo (varies) | ~$299 to $399/mo with dietitian | No (telehealth Rx included) | Nutrisense app + human nutritionist | First-timers who want coaching |
| Levels | Stelo (post-2024 shift) | ~$199/mo membership + sensors | No | Levels app with zone scoring and food log | Biohackers who want the slickest UX |
A few things to notice. The sensors are commodities. A Dexcom sensor is a Dexcom sensor whether it's labeled Stelo or sold through Levels. What you're paying for in the $200 to $400 range is app, coaching, and interpretation — not hardware accuracy.
For accuracy nerds: Dexcom G7 has a mean absolute relative difference (MARD) around 8.2% in recent studies, Libre 3 around 7.9%. Stelo is a less-filtered variant and can read a few mg/dL higher at peaks. All four are close enough that the difference will not change how you interpret your month of data.
When a $300 CGM Month Is Worth It (and When It's Overkill)
Our honest take, after looking at hundreds of member CGM experiments:
Worth It If…
- You've never used a CGM and want to learn your body's actual responses for 2 to 4 weeks. One month is genuinely educational.
- Your HbA1c is 5.5 to 5.9% and you want to see the pattern behind the number before it drifts into prediabetes.
- You have a strong family history of type 2 diabetes and want an early-warning dashboard.
- You're experimenting with specific interventions — time-restricted eating, low-carb, endurance fasted training — and want real-time feedback for a defined window.
- You're losing weight and want to understand how your individual body handles your actual food choices, not generic glycemic index charts.
Probably Overkill If…
- You have a normal HbA1c, normal fasting insulin, no family history, no symptoms, and a stable weight.
- You're planning to wear one indefinitely as a lifestyle, at $200+ per month. The marginal insight after month two is tiny.
- You're anxious about food and the data will amplify that. Several registered dietitians have written about CGM-related disordered eating. Take this seriously.
- You're hoping it will cause weight loss on its own. It won't. Multiple RCTs in non-diabetics have shown CGM-driven weight loss is modest and largely explained by the general attention effect of any self-monitoring tool.
In most cases we'd rather see a member spend $150 on a proper biomarker panel — ApoB, hs-CRP, HbA1c, fasting insulin, and homocysteine — than $300 on a month of CGM data. Those five markers tell you more about your disease trajectory. CGM is complementary, not foundational.
Do CGMs Actually Help With Weight Loss?
Short answer: sometimes, modestly, and probably not for the reason the marketing says.
The mechanism people assume — "avoiding spikes lowers insulin, which unlocks fat loss" — is an oversimplification at best. In metabolically healthy adults, insulin response follows the food you eat regardless of whether you're wearing a sensor. What a CGM does is increase food awareness. You see the spike from the "healthy" granola bar and you stop eating the granola bar. That's behavior change, not metabolic magic.
A 2023 review in Nutrients looked at CGM-driven interventions in non-diabetic adults and concluded that short-term weight loss effects were real but modest (1 to 3 kg over 12 weeks) and tended to regress once the sensor came off and novelty wore off. The honest reading is that a CGM is a temporary behavior-modification tool, similar to a food diary with better graphics.
If you're using it as a weight-loss device, give yourself a defined window — say 8 weeks — build the dietary habits you want to keep, and then put the sensor away.
Sleep, Stress, and the Non-Food Glucose Drivers
One of the most useful CGM lessons for non-diabetics has nothing to do with food. It's the visibility into how your glucose reacts to things you wouldn't have suspected.
- One night of 5-hour sleep: next-day fasting glucose can rise 10 to 15 mg/dL. Postprandial peaks for the same meal go higher.
- A stressful work meeting: cortisol release can bump glucose 15 to 30 mg/dL without any food.
- A hard interval workout: short spike from adrenaline, then improved insulin sensitivity for hours afterwards. A carb-heavy meal post-workout often produces a smaller peak than the same meal on a rest day.
- Cold plunges or saunas: small catecholamine-driven bumps, usually meaningless.
If you want to see how your sleep intersects with glucose, our 7-night sleep audit gives you a protocol to diagnose your sleep pattern. Running it concurrently with a CGM block is how you actually find the crossover — the nights your sleep collapsed and your next-day glucose told on you.
How to Actually Run a 30-Day CGM Experiment
If you're going to do this, do it properly. A 30-day wear is long enough to build a real dataset and short enough to stay disciplined.
- Week 1 — Baseline. Don't change anything. Eat the way you normally eat. Track everything — meals, workouts, sleep, alcohol, stress events. The point of week one is to see what your ordinary life looks like on glucose.
- Week 2 — Meal discovery. Repeat the same meals with small variations. Oatmeal alone vs oatmeal with nuts and berries. Rice alone vs rice with vinegar vs rice after a 10-minute walk. The comparison matters more than the absolute numbers.
- Week 3 — Stress and sleep test. Pay attention to nights you slept under 6 hours and days with high work stress. Look at the next-day fasting values and post-meal peaks.
- Week 4 — Intervention test. Pick one thing — a post-meal walk, protein-first meals, cutting liquid sugar, 12-hour eating window — and run it consistently. Compare CV, MAGE, and peak magnitudes to week one.
At the end of 30 days you should have a written page of personal rules. Not universal truths. Rules for your body. That page is the output. Not the sensor itself.
The Two Mistakes Almost Everyone Makes
The first mistake is spike panic. People see a 155 mg/dL peak from a real-life meal and decide carbohydrates are toxic. They eliminate fruit, cut their post-workout rice, and a month later their running performance is gone and they're obsessing about numbers. Peaks are fine. Magnitude, frequency, and recovery time together tell the story.
The second mistake is subscription creep. What was supposed to be a 30-day education turns into month 6 of a Levels membership. The marginal learning curve flattens hard after week 4. If you find yourself renewing because the app is "part of your routine," ask whether you're still learning anything — or whether you're just paying $200 per month for a wearable comfort blanket.
Both mistakes have the same root cause: the data feels meaningful because it's continuous and personal, and the apps are designed to keep you engaged. Your job is to extract the insight and then get out.
Where a CGM Fits in the Bigger Health Picture
A CGM is one data stream. Useful, not foundational. The hierarchy of metabolic signal, roughly in order of actionability for a non-diabetic:
- HbA1c — cheap, covered by insurance, the best single snapshot of 3-month glucose trajectory.
- Fasting insulin — the earliest warning for insulin resistance, often 10+ years before glucose moves.
- Waist circumference / visceral fat — the lifestyle proxy that predicts metabolic disease better than BMI.
- CGM (time-boxed) — pattern recognition for your specific body and specific foods.
- HOMA-IR, oral glucose tolerance test, Kraft insulin assay — for the genuinely curious or those with a concerning pattern.
Skipping the first two and jumping straight to a CGM because it's the shiniest option is how people end up with a lot of data and very little clarity about whether they're actually on a good trajectory.
Ready to Correlate Your CGM Data With Everything Else?
The single biggest limitation of a CGM on its own is that it only sees glucose. Your body is running a lot of other processes — sleep architecture, HRV, training load, cortisol, hydration, cycle phase — and any of them can bend a glucose curve without a single gram of carbohydrate involved.
OnePersonHealth's AI ingests your CGM data alongside your wearable, meals, supplements, and labs, then runs a nightly analysis that correlates variables you would never connect manually. Your glucose spiked on Tuesday and Thursday — the AI tells you both were nights you slept under six hours after evening alcohol, and that your post-meal peaks on low-HRV days averaged 19 mg/dL higher than on recovered days. That is the layer of interpretation no CGM app alone can give you.
What We Tell Members Asking "Should I Get One?"
Three questions, honestly answered, usually settle it:
- Do you know your HbA1c and fasting insulin? If not, do those first. $30 to $150, one blood draw, more disease-relevant signal than any CGM.
- Are you willing to treat this as a 30-day experiment with a written output, not a subscription? If yes, go. If no, the ROI falls off a cliff.
- Are you at risk of becoming anxious about food? If there's any history of disordered eating, skip the CGM. The data will not make you healthier; it will give your anxiety a new target.
If you pass all three, pick the cheapest OTC sensor that works (Stelo or Lingo), skip the expensive coaching layer for your first month unless you genuinely want the hand-holding, and commit to the 30-day experiment structure above.
Put This Into Action
- Get your HbA1c and fasting insulin tested first. These are cheaper, more disease-predictive, and give your CGM data context.
- Pick an OTC CGM if you're a first-timer. Dexcom Stelo or Abbott Lingo will give you 80% of the insight for 50% of the cost of Levels or Nutrisense.
- Run a structured 30-day experiment. Week 1 baseline, week 2 meal discovery, week 3 sleep and stress, week 4 intervention test.
- Read CV, MAGE, and time in range — not individual peaks. CV under 36%, MAGE under 40 mg/dL, TIR 70 to 140 above 90%.
- Write your personal rules at the end of day 30. One page. Foods, timings, sleep rules, workout windows that actually work for your body.
- Take the sensor off. Unless you're in a specific tracking window or have a metabolic reason, indefinite CGM wear gives you diminishing returns. Re-run another 30-day block in 6 to 12 months if you've made major lifestyle changes.
- Correlate the CGM data with everything else. Glucose alone is a partial story. Let OPH cross-reference your sensor with your sleep, HRV, and labs so the lessons stick.
The Bottom Line
A CGM is a remarkable tool that reveals things about your metabolism you cannot see any other way. It is also the most over-interpreted data stream in consumer health. Peaks are not disease. Variability is. Dawn phenomenon is normal. Time in range above 90% at 70 to 140 mg/dL matters more than any single meal's graph. And for a metabolically healthy adult, a well-designed 30-day experiment will teach you almost everything a year-long subscription would.
Use it for a month. Learn your body. Write your rules. Move on. The goal was never to wear a sensor forever — it was to understand what you already are.